les bons liens du web
les bons liens du web
Nuage de tags
Mur d'images
Quotidien
Flux RSS
Connexion
Rester connecté
Mur d'images - 132 images
WazuhHound - Cartographier votre infrastructure Wazuh avec BloodHound CE - Aukfood
Traefik Log Dashboard : un œil sur les logs de Traefik - Shaarli de Riduidel
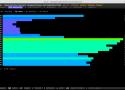
GyulyVGC/sniffnet: Comfortably monitor your Internet traffic 🕵️♂️
Argos monitoring 0.10.0 documentation
Moooooonitoring the Cow.txt Herd - Hacker News
Little Snitch, the macOS network tool, is now available on Linux - OMG! Ubuntu
acidvegas/zpulse: Real-time ZFS & SMART monitoring dashboard for multi-server home racks
My First Fully Agentic Coding Project: GitTop - Lobsters (hjr265.me via carlana)
Argus
GitHub - koala73/worldmonitor: Real-time global intelligence dashboard — AI-powered news aggregation, geopolitical monitoring, and infrastructure tracking in a unified situational awareness interface
Redwatch: "80% des incidents de cette ent…" - Mastodon.top
Zabbix roadmap
AkuLink1/zabbix-template-apt-upgrade-monitoring: Zabbix template that monitors a host for package upgrades available in Debian / Ubuntu / "apt" package manager distros using apt-get upgrade -s (simulation mode).
GitHub - autobrr/netronome: Netronome is a modern network speed testing and monitoring tool built with Go and React.
Phare - All you need to run successful websites
GitHub - grafana/mcp-grafana: MCP server for Grafana
robusta-dev/krr: Prometheus-based Kubernetes Resource Recommendations - Morgan - Cacahuètes 🥜
farshadnick/Gemini-Zabbix-Integration: AI-Powered Zabbix Monitoring with Google Gemini Seamlessly integrate Google Gemini AI into your Zabbix monitoring to get intelligent alert analysis, predictive insights, and automated troubleshooting suggestions
Vous avez une Freebox ? Cette version remaniée de Freebox OS risque de vous plaire - Numerama
Beszel | Simple, lightweight server monitoring
cry-inc/dmarc-report-viewer: Lightweight Standalone DMARC and SMTP TLS Report Viewer with IMAP Client
Exporter les métriques de MariaDB avec Alloy - Aukfood (Guillaume Chéramy)
How to monitor your Laravel app for critical vulnerabilities - Freek Van der Herten's blog on PHP, Laravel and JavaScript - Mes liens
Track any website for content changes | Open-source Projects | Open-source Projects
sslcheck: Command-line tool to check and monitor SSL certificate expiration across multiple domains - Lobsters (github.com by i04n)
phptop: PHP basic ressource profiler safe and useful for production sites - Lobsters (github.com via Cassandre)
molu8bits/modsecurity-parser: modsecurity audit log analyser and parser
agapoff/check_kubernetes: Nagios/Icinga/Zabbix style plugin for checking Kubernetes
Zabbix Documentation - 1 High availability
The Open-Source On-Call Integration - DEV Community
henrygd/beszel: Lightweight server monitoring hub with historical data, docker stats, and alerts.
netdata/netdata: Architected for speed. Automated for easy. Monitoring and troubleshooting, transformed!
2 Remote commands
Releases · mikesart/inotify-info
Observabilité Informatique : Comprendre les bases 1ère partie
Prometheus 3.0: A Quantum Leap in Monitoring - DEV Community
Monitoring Pleroma with Grafana and stuff - Coffee and Dreams
GitHub - traceloop/openllmetry: Open-source observability for your LLM application, based on OpenTelemetry
Releases · NETWAYS/check_prometheus
GitHub - KevinKrumbiegel/check_gitlab: Nagios plugin for doing a GitLab health check
Optimisation des ressources Kubernetes avec l’autoscaling horizontal des pods via des custom metrics et le Prometheus Adapter - Journal du Hacker (zwindler)
Sauvegarder des dashboards Grafana dans Kubernetes, en s’amusant (j’explique les RBAC, Job et les CronJob)
ddddddO/packemon: Packet monster (っ‘-’)╮=͟͟͞͞◒ ヽ( '-'ヽ) TUI tool and Go library for sending packets of arbitrary input and monitoring packets on any network interfaces (default: eth0).
Simplify Kubernetes Monitoring: Kube-prometheus-stack Made Easy with Glasskube - DEV Community
Kubernetes overview: Operate cluster data on the frontend
GitHub - TwiN/gatus: ⛑ Automated developer-oriented status page
GitHub - robusta-dev/robusta: Kubernetes observability and automation, with an awesome Prometheus integration
Argos Panoptès : la supervision de sites web simple et efficace – Framablog
Comment surveiller et debugger vos conteneurs Docker ?
GitHub - prometheus/collectd_exporter: A server that accepts collectd stats via HTTP POST and exports them via HTTP for Prometheus consumption
helm-charts/charts/kube-prometheus-stack at main · prometheus-community/helm-charts · GitHub
Angular support deprecation | Grafana documentation
Owloops/updo: Uptime monitoring CLI tool with alerting and advanced settings
zabbix-ipsec/README.md at master · a-schild/zabbix-ipsec
zabbix_server reports "cannot create locks" - ZABBIX Forums
GitHub - grafana/pyroscope: Continuous Profiling Platform. Debug performance issues down to a single line of code
thecamels/zabbix: Script and templates for Zabbix
domainaware/checkdmarc: A parser for SPF and DMARC DNS records
Looking Beyond Atlassian StatusPage: The 5 Best Alternatives - DEV Community
Nginx - module VTS - statistique par Virtual Host - RDR-IT
Setup Nagios Server with nsca-ng for DRLM - Brain Updaters
John Shaft / DNS Tools · GitLab
no alert when zabbix proxy no running - ZABBIX Forums
Redistop : un outil pour observer votre instance Redis en temps réel | blog Bearstech
Akvorado : collecteur et visualisateur de flux réseau
Normaliser la télémétrie | blog Bearstech
Portmaster 1.0 – Open-Source Network Monitor and Privacy Firewall · Hacker News
GitHub - voxpupuli/puppetboard: Web frontend for PuppetDB
Énergie : comment être informé en temps réel des coupures d'électricité à venir cet hiver ?
Proxmox - Tips and tricks · Journal du Hacker
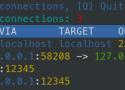
GitHub - nojhan/tunnelmon: tunnelmon is an (auto)ssh tunnel monitor. It gives a user interface to monitor existing SSH tunnels, and tunnels that are managed with autossh.
OPMDG/check_pgactivity: Nagios remote agent
GitHub - nobodysu/zabbix-dnscheck: External check for monitoring host's dns entries without access to the server. Supports A, AAAA, PTR, MX and TXT records. With LLD and bulk data sending.
GitHub - pavelnemirovsky/zabbix-redis-template: Multi Instance Redis Discovery Template for Zabbix
Zabbix read NRPE(nagios agent)?? - ZABBIX Forums
17. Encryption
facebookarchive/puewue-frontend: The front-end to a simple application that displays Facebook's datacenter power consumption and other information.
Dashy – Le tableau de bord des gens qui s’auto-hébergent
GitHub - statping/statping: Status Page for monitoring your websites and applications with beautiful graphs, analytics, and plugins. Run on any type of environment.
david.durieux.family – FusionInventory plugin pour GSIT et GLPI - inventaire télétravail
google/cadvisor: Analyzes resource usage and performance characteristics of running containers.
GPh83/MailServerMonitor: Simple mail server monitoring with historic in CSV format
Problem with epoch timestamps to human readable date conversion - Grafana / Singlestat Panel - Grafana Labs Community Forums
XavierBerger/RPi-Monitor: Real time monitoring for embedded devices
Plant Monitor - Using IoT, MongoDB and Flutter - DEV Community
GitHub - dalibo/temboard: PostgreSQL Remote Control
Gandi/prometheus-linux-nfsdv4-exporter
Speedtest Tracker, ou comment surveiller votre débit Internet automatiquement · Journal du Hacker
Free Cron Job Monitoring - Healthchecks.io · Shaarli de Riduidel
bortzmeyer/check_expire: A Nagios (and compatible) plugin to check the impending expiration of a domain name. It relies on RDAP exclusively (no whois) and works with every top-level domain with RDAP (which includes all the ICANN ones). - check_expire - La forge Chapril
Force housekeeper on hudge DB - ZABBIX Forums
ZABBIX: les nouveautés de la version 5.4 - YouTube
Analyse and Visualize DMARC Results using Open-Source Tools - Debricked
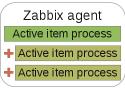
Multiple servers for active agent? Sure! – Zabbix Blog
France: Russian state hackers targeted Centreon servers in years-long campaign | ZDNet
Installer Cockpit sous Debian 10 pour superviser son serveur · Journal du Hacker
Fiat Tux / Munin / Coffee plugin · GitLab
UserParameter with awk and dollar signs - ZABBIX Forums
bpytop : Un moniteur système en python très réactif et qui claque · Journal du Hacker
Supervision de SystemD avec systemd-cgtop · Journal du Hacker
Centralisation des logs, un outil pour la sécurité | | Sécurité | IT-Connect
Introducing Grafana Cloud Agent, a remote_write-focused Prometheus agent that can save 40% on memory usage | Grafana Labs
Healthchecks - Supervision de Cron - L'admin sous GNU / Linux - Blog Libre
cpmarvin/lnetd: dynamic network topology from IGP information
Logging & monitoring : définitions et bonnes pratiques · Journal du Hacker
Proxmox VE + Prometheus =
Maximilian Eschenbacher / icinga2-xmpp-notification · GitLab
FreeBSD: Install Prometheus, Node Exporter and Grafana – Blog of Kliment Andreev – A place so I won't forget things
Automatically chose retention policy based on time range · Issue #4262 · grafana/grafana · GitHub
Superviser une infrastructure avec Prometheus (Part 1 - Fonctionnement) · Journal du Hacker
beufanet/linkyndle: Fetch dataset from Enedis portal (need Linky) and push it to grafana
Weather - Forecast dashboard for Grafana | Grafana Labs
Analyzing Fitbit Data with Telegraf & Grafana — Michael Greene
vozlt/nginx-module-vts: Nginx virtual host traffic status module
Icinga X.509 Module | Icinga
How to monitor log file with date in name ? - ZABBIX Forums
Internet of Laundry — Let the ESP8266 Watch Your Dirty Drawers Get Clean | Hackaday
Presets for collectd? · Issue #266 · facette/facette
Installation de Collectd, Graphite et Grafana - Partie 1 | MNT-TECH - Sysadmin blog
Surveiller le trafic web avec SquidAnalyzer sous CentOS · Journal du Hacker
SystemStatus - Un script pour informer vos clients de l'état de vos services - Korben
Key metrics for PostgreSQL monitoring
GitHub - naparuba/opsbro: Ops Best friend
How To Install and Configure Grafana to Plot Beautiful Graphs from Zabbix on CentOS 7 | DigitalOcean
Coming soon: Oh Dear! - Monitoring for the encrypted web
NetData: Get control of your Linux Servers. Simple. Effective. Awesome.
GitHub - bhuisgen/zabbix-docker: Docker monitoring agent for Zabbix
Free Mobile : déclencher un SMS avec un simple email
GitHub - jbfavre/python-protobix: Very simple python module implementing Zabbix Sender protocol.
jjmartres/Zabbix
KEEP CALM AND WAIT FOR ZABBIX OK - KEEP CALM AND CARRY ON Image Generator - brought to you by the Ministry of Information
Mysql Database Grow | How Optimize parameters
Replier
Replier tout
Déplier
Déplier tout
Êtes-vous sûr de vouloir supprimer ce lien ?
Êtes-vous sûr de vouloir supprimer ce tag ?
Le gestionnaire de marque-pages personnel, minimaliste, et sans base de données par la communauté Shaarli